The "Mood" report in the "Statistics" section is a tool for HR professionals and managers that allows you to track your team's psycho-emotional state in real time, promptly notice burnout, and collect feedback from employees.
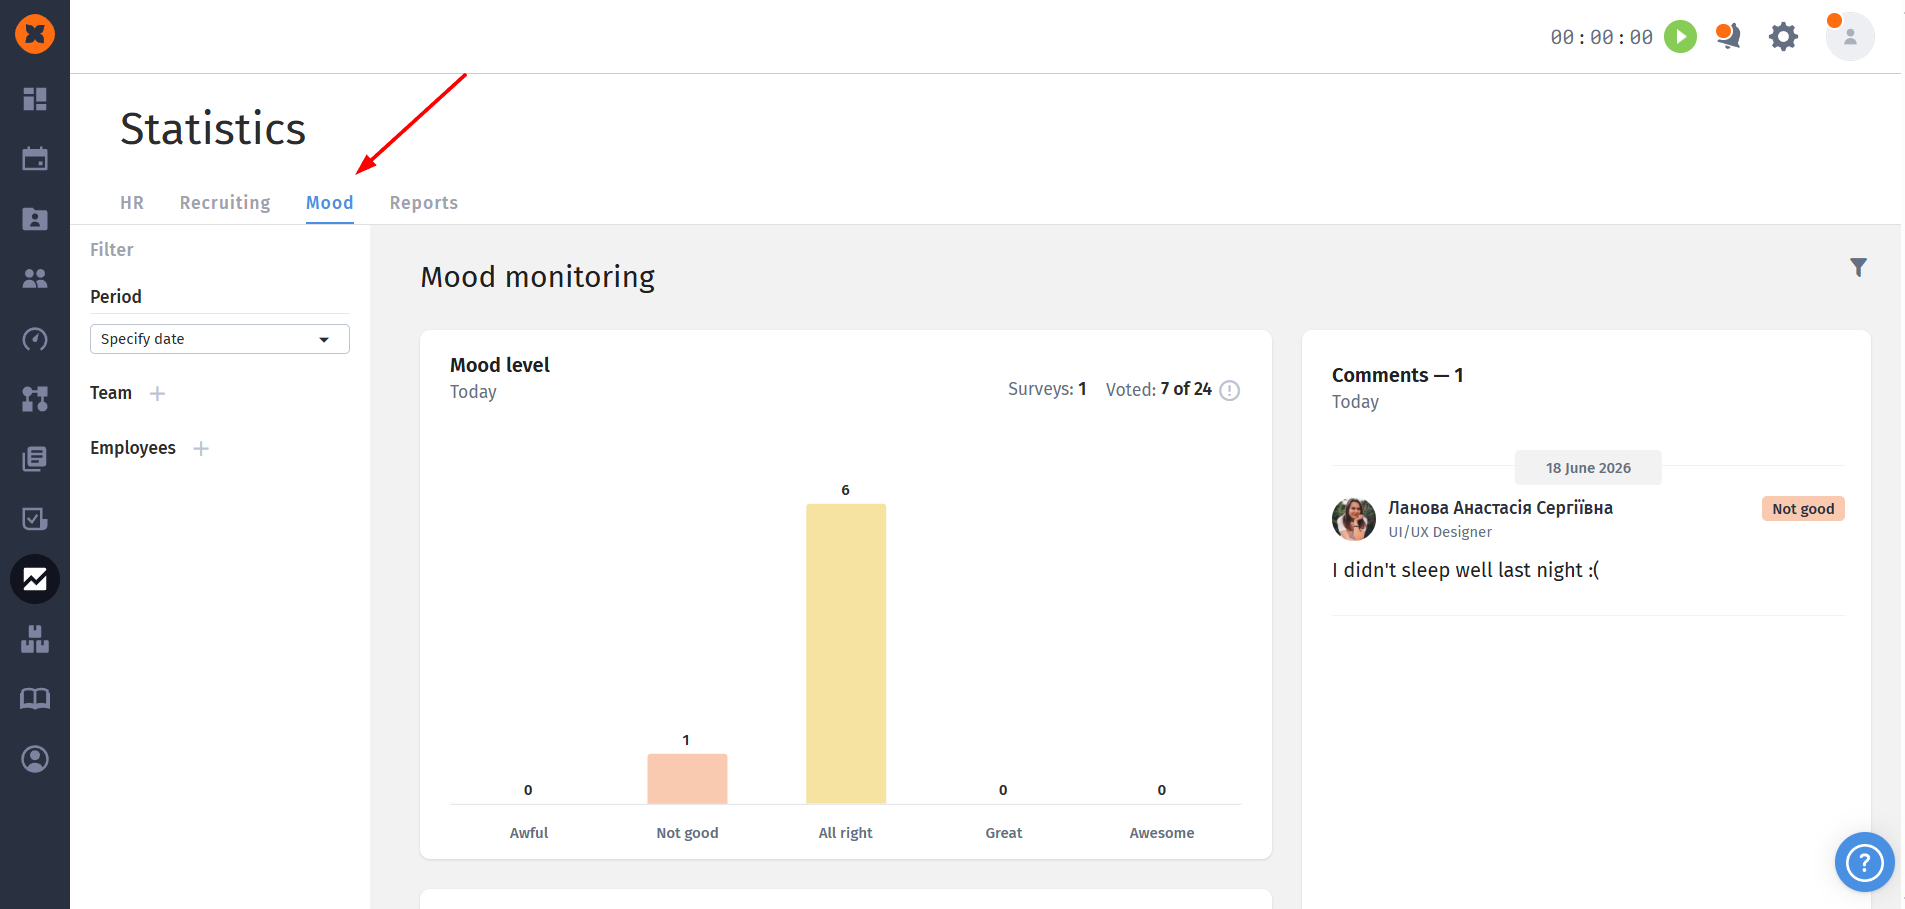
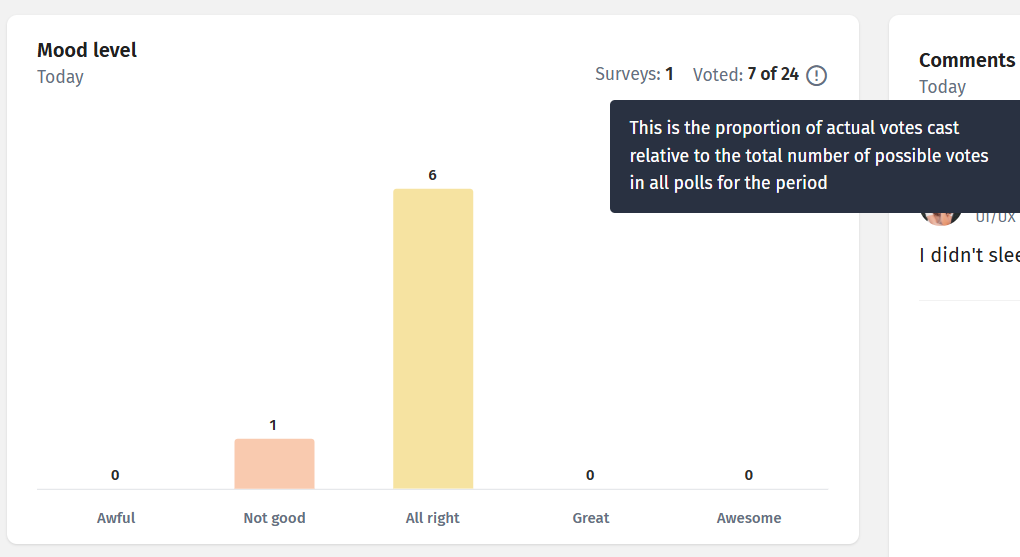
The chart displays the distribution of employee ratings for the current day;
Rating scale: mood is rated on a 5-point scale: Bad, Not great, Okay, Good, and Excellent.
Voting indicators: at the top you can see the number of active polls, as well as the overall voting progress (for example, Voted: 7 out of 42).
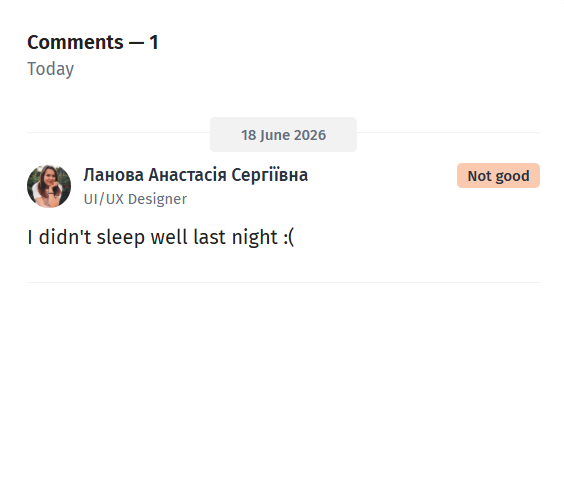
To the right of the chart, a comment feed is displayed. If an employee decided to elaborate on their choice (for example, selected a rating "Not really" and left a comment), you will have access to this information linked to the date, name, and position of your colleague.
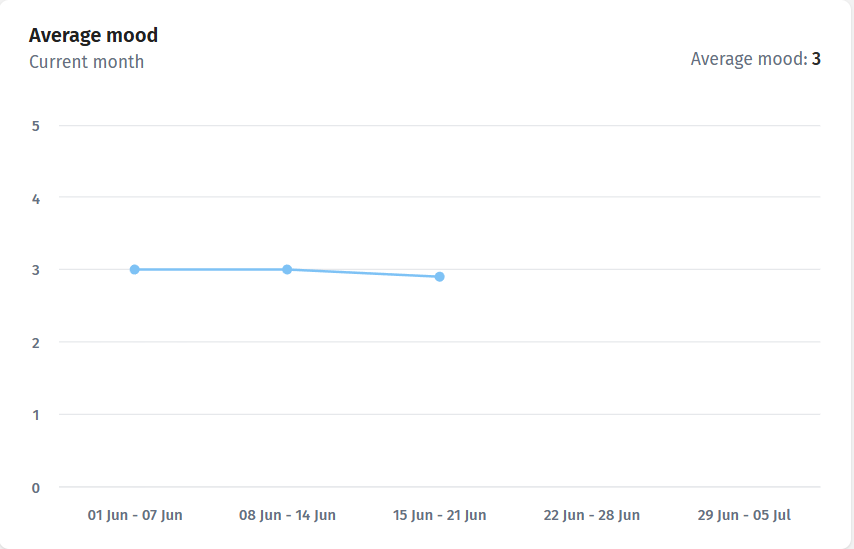
Average score: the average team mood score for the day is calculated automatically;
Trend chart: a line chart allows you to track how the average mood changed over a week or month, helping to identify patterns (for example, a drop in productivity or general fatigue at the end of a release).
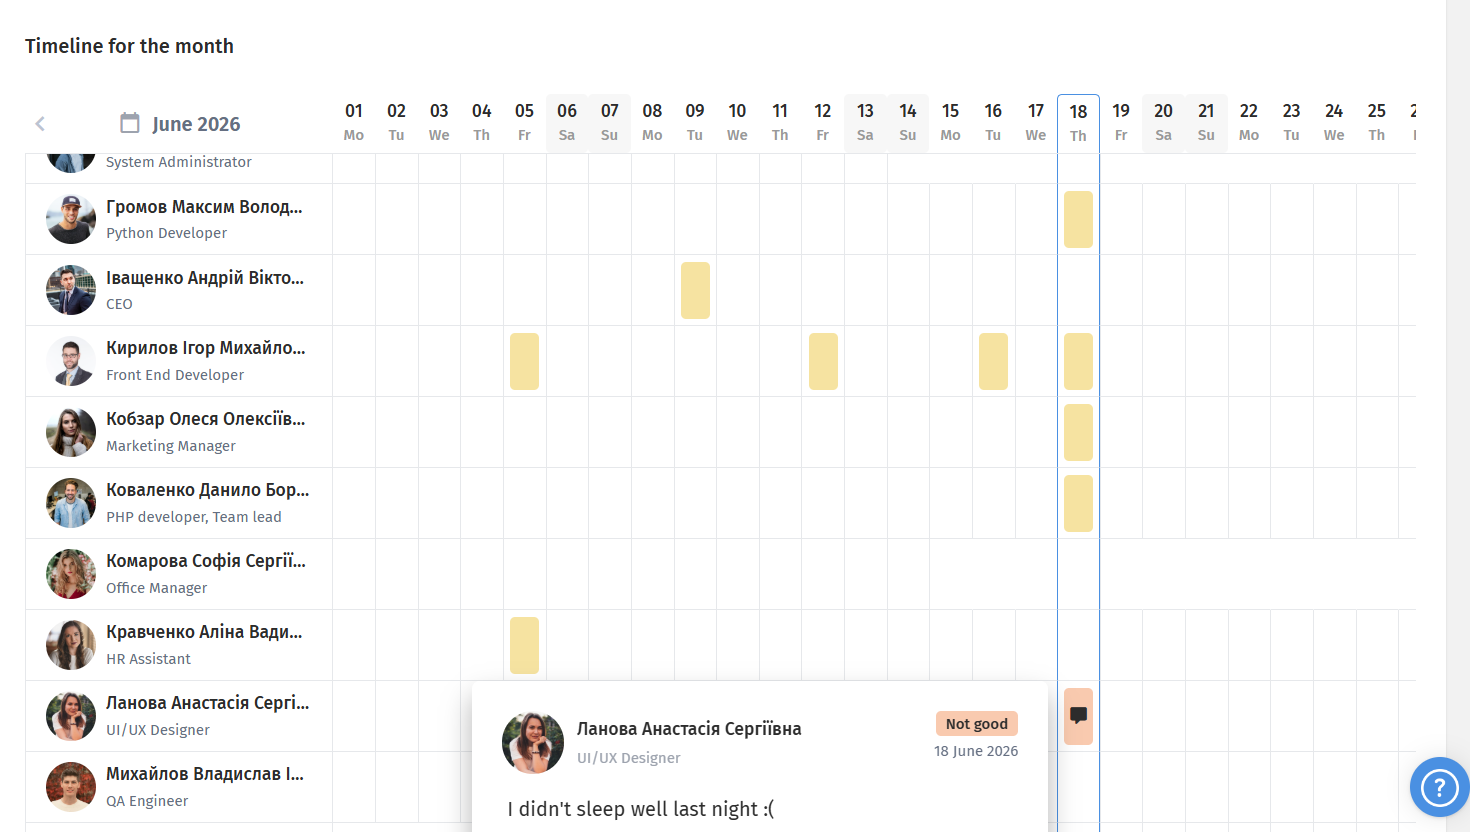
A convenient interactive grid that shows the response history of each employee on a daily basis:
Each day is color-marked according to the rating left;
If an employee left a text comment, a message icon appears on the corresponding cell 💬. Clicking on it opens a window with details.
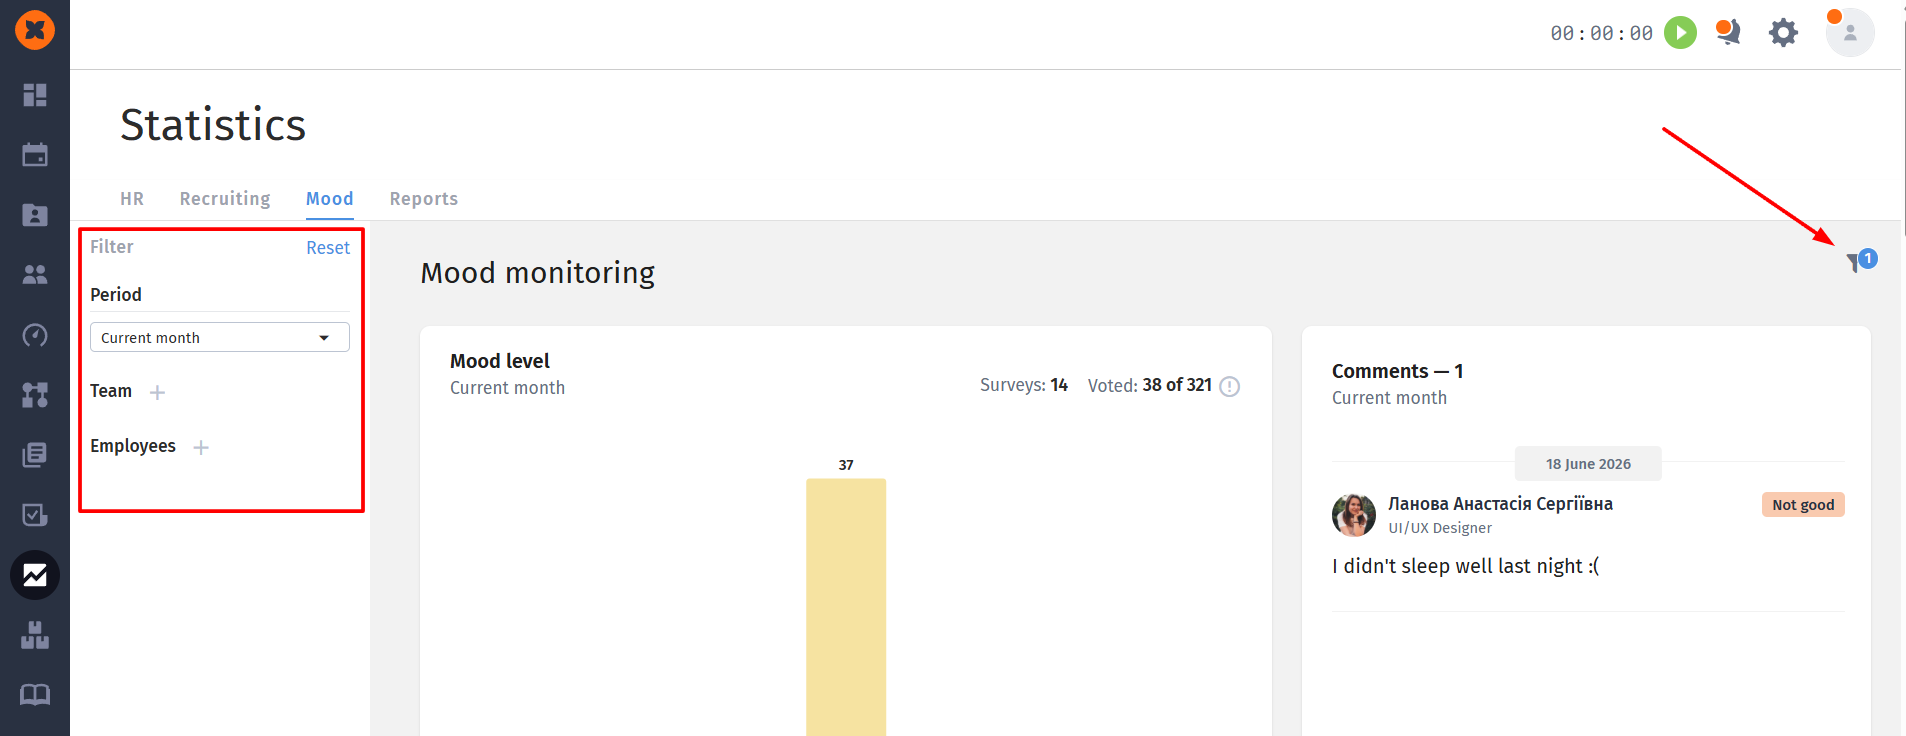
For in-depth data analysis, you can use the flexible filter panel on the left:
Period: select a specific day, week, or month to view history;
Team: filter data by specific departments (for example, only QA or Marketing);
Employees: view individual statistics of a specific colleague.